Fitness Sensitivity
In our 2025 paper we benchmarked the sensitivity and robustness of evolved circuits under prolonged evaluation. To quantify robustness, single circuits were frozen and repeatedly evaluated without modifying their bitstreams. Pulse-count oscillators were exercised for 24 hours, while variance-maximization circuits were sampled for shorter three-hour windows because their distributions remained stable.
Pulse Count Oscillators
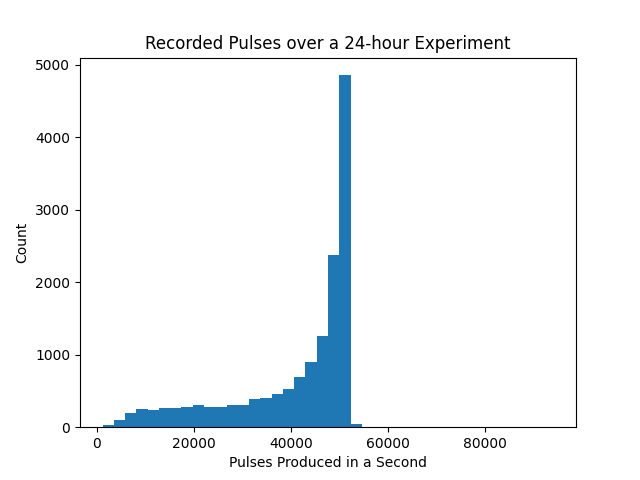
Even after thousands of trials, pulse counts cluster tightly around the desired frequency (50 kHz in this run). Desired frequencies from 30–90 kHz were tested; the correlation between mean recorded frequency and coefficient of variation was only 0.0239, indicating that higher targets are not inherently less stable.
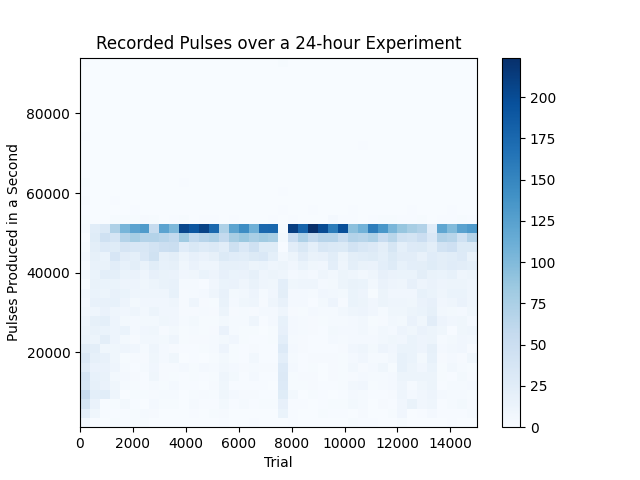
Short-lived dips (e.g., near trial 8,000) appear before the circuit naturally recovers, suggesting minor environmental disturbances such as HVAC cycles or USB bus contention. Because the Bitstream Evolution runtime already samples each candidate multiple times per generation, these perturbations rarely derail ongoing experiments.
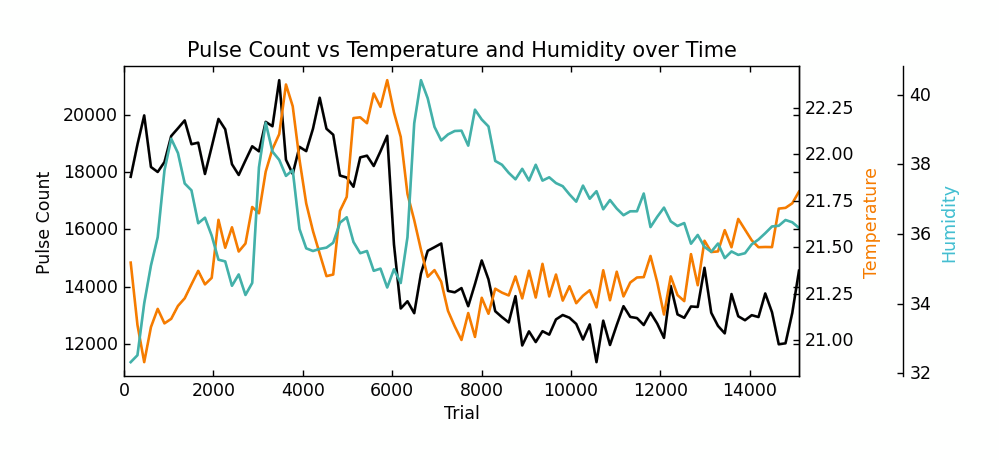
A pronounced drop in measured frequency aligns with a simultaneous change in temperature and humidity. Even after the environment returned to its baseline, the circuit never fully recovered, underscoring that certain conditions can induce lasting shifts in analog behavior.
Variance Maximization Circuits
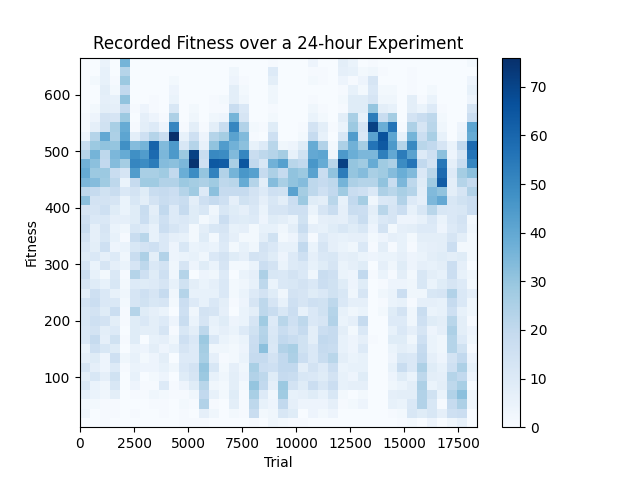
Pulling the best circuit from every tenth generation and replaying them for three hours revealed near-zero correlation between generation index and coefficient of variation (0.0046). In other words, variance circuits stay just as stable as evolution progresses, and stochastic noise in the measurement pipeline averages out over repeated sampling.
Practical Guidance
- Repeated self-evaluation is a quick litmus test before attempting transfers—unstable circuits will show high coefficients of variation long before they fail on a second FPGA.
- Logging temperature and humidity alongside fitness traces helps explain sudden performance cliffs and provides data for future environment-aware fitness functions.
- Because consistency does not automatically improve with fitness, we can consider multi-sample or variance-penalizing objectives when robustness is the primary goal.